23 Feb 2026
Investors often want to evaluate not just the returns of their investments but also the risks taken to achieve those returns. Two widely used metrics in mutual fund analysis are the Sharpe Ratio and the Information Ratio. While both assess risk adjusted performance they serve distinct purposes, the Sharpe Ratio measures return relative to total risk while the Information Ratio evaluates a fund manager’s ability to consistently deliver returns above a benchmark. Understanding these differences helps investors make informed decisions, select funds wisely and build potentially optimized portfolios
Key Takeaways
- Sharpe Ratio measures the overall risk adjusted return of an investment considering total volatility relative to a risk free rate
- Information Ratio evaluates a fund manager’s ability to consistently outperform a benchmark accounting for the volatility of active returns (tracking error)
- A higher Sharpe Ratio indicates better returns for the total risk taken while a higher Information Ratio indicates stronger fund manager skill and possible benchmark outperformance
- Sharpe Ratio is suitable for comparing funds across different categories or asset classes whereas Information Ratio is for comparing actively managed funds within the same benchmark.
- Using both ratios together along with other metrics like Alpha, Beta and Sortino Ratio provides a holistic view of fund performance and may help in building well balanced portfolios
What is Sharpe Ratio?
The Sharpe Ratio introduced by Nobel laureate William F. Sharpe evaluates how much return an investment generates for each unit of total risk it carries. In simple terms it answers the question “Is the return worth the risk I am taking”
Formula:
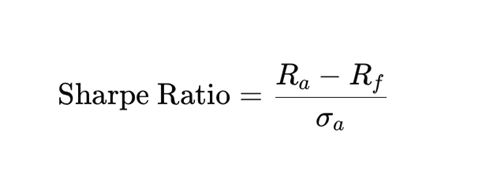
Where
- Ra is the average return of the asset (or mutual fund)
- Rf is the risk-free rate of return (typically the return on government bonds or Treasury bills)
- σa is the standard deviation of the asset's return, which measures the volatility or risk
Key Points
- Measures overall volatility not relative performance against a benchmark
- A higher Sharpe Ratio indicates better risk adjusted performance
- Helps investors compare funds with different risk levels effectively
Example Comparison of Mutual Funds
| Fund | Return (%) | Volatility (%) | Risk Free Rate (%) | Sharpe Ratio |
|---|---|---|---|---|
| Fund A | 10% | 8% | 3% | 0.87 |
| Fund B | 12% | 10% | 3% | 0.90 |
What is Information Ratio?
The Information Ratio (IR) measures a fund manager’s ability to generate potential excess returns over a benchmark adjusted for the volatility of those excess returns known as the tracking error. Unlike the Sharpe Ratio which considers total risk the Information Ratio focuses on fund manager skill and consistency in active fund management.
Formula
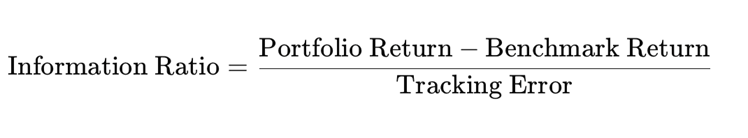
Where:
- Portfolio Return: The annualized return generated by the fund/portfolio during a particular period, usually expressed in percentage terms.
- Benchmark Return: The annualized return of a comparable index (e.g., NIFTY 50, BSE 30), also measured in percentage terms.
- Standard Deviation of Excess Return: Measures how much a funds return deviate from its benchmarks return over time.
Key Points
- Measures active risk not overall volatility
- Suitable for comparing funds within the same category or benchmark
- A higher IR may indicate the fund manager consistently outperforms the benchmark with controlled risk
Example
| Portfolio | Portfolio Return (%) | Benchmark Return (%) | Tracking Error (%) | Information Ratio |
|---|---|---|---|---|
| Fund X | 12% | 10% | 2% | 1.0 |
| Fund Y | 11% | 10% | 1% | 1.0 |
Even with similar active returns the IR shows the fund’s efficiency relative to the benchmark helping investors identify managers who consistently deliver value added performance
Sharpe Ratio vs Information Ratio - Core Differences
| Feature | Sharpe Ratio | Information Ratio |
|---|---|---|
| Benchmark Used | Risk-free rate (e.g., government securities) | Specific market index or category benchmark |
| Risk Measured | Total risk (standard deviation of returns) | Active risk (tracking error relative to benchmark) |
| Purpose | Assess overall risk-adjusted performance | Evaluate manager skill and consistency |
| Suitable For | Comparing funds across categories | Comparing active funds within same benchmark |
| Focus | Total returns vs total volatility | Excess returns vs benchmark volatility |
| Interpretation | Higher Sharpe = Better risk-adjusted returns | Higher IR = More consistent outperformance |
In short
- Sharpe Ratio = How much return per unit of total risk.
- Information Ratio = How consistently a fund manager may beat a benchmark relative to active risk
Sharpe vs Information Ratio - Who Should Choose Which
Understanding Sharpe and Information Ratios can help investors make smarter, risk aware investment decisions. While each ratio serves a distinct purpose, using them together provides a more complete view of fund performance.
1) Sharpe Ratio - Measuring Risk Adjusted Returns
The Sharpe Ratio evaluates how much return a fund generates for the risk taken. It’s suitable for
- Comparing funds across categories or asset classes
- Identifying investments that deliver better returns for their level of volatility
- Making informed decisions for long term and risk conscious investing
2) Information Ratio - Measuring Manager Skill
The Information Ratio assesses a fund manager’s ability to consistently beat a benchmark after adjusting for tracking error. It helps investors
- Compare funds within the same category
- Gauge manager consistency and skill
- Identify funds where active management adds real value
3) Using Both Ratios Together
By combining both ratios, investors can gain a more holistic perspective
- Sharpe Ratio shows overall risk adjusted performance
- Information Ratio highlights whether the manager’s decisions enhance returns relative to the benchmark
- Together with other metrics like Alpha, Beta and Sortino Ratio, they enable better portfolio construction balancing risk, benchmark performance and managerial expertise
Limitations of Sharpe and Information Ratios
While both ratios are valuable they have certain limitations
Sharpe Ratio
- Depends on historical returns which may not predict future performance accurately
- Assumes normally distributed returns which may not hold in volatile markets or alternative assets
- Focuses only on total volatility ignoring other risks like liquidity or credit risk
- Less useful for comparing funds with different benchmarks since it doesn’t consider relative performance
Information Ratio
- Sensitive to benchmark choice - an inappropriate benchmark can distort the ratio
- Short term data may be misleading as limited history can exaggerate or understate performance consistency
- Ignores total risk - it focuses solely on active risk (tracking error) and may overlook overall volatility
Conclusion
Both the Sharpe Ratio and Information Ratio are essential tools for investors seeking to understand mutual fund performance. While the Sharpe Ratio gives insight into returns per unit of total risk the Information Ratio focuses on manager skill and consistency relative to a benchmark. By understanding their differences and applying them appropriately investors can make informed decisions & select funds wisely.
FAQs
1. What is the Sharpe Ratio?
The Sharpe Ratio measures the risk adjusted return of an investment by comparing its excess return over a risk free rate to the total volatility of the investment. A higher ratio may indicate better performance for the risk taken.
2. What is the Information Ratio?
The Information Ratio evaluates a fund manager’s ability to generate excess returns over a benchmark adjusted for the volatility of those returns (tracking error). It highlights fund manager skill and consistency.
3. How do Sharpe Ratio and Information Ratio differ?
The Sharpe Ratio measures total risk adjusted returns relative to a risk free rate while the Information Ratio measures active returns relative to a benchmark focusing on manager skill and consistency.
4. Which ratio should investors use?
Use Sharpe Ratio to compare funds across different categories or asset classes. Use Information Ratio to compare actively managed funds within the same benchmark.
5. Can both ratios be used together?
Using both provides a comprehensive view of fund performance - Sharpe Ratio for overall risk adjusted returns and Information Ratio for benchmark relative performance helping investors make informed decisions.
Disclaimers
Investors may consult their Financial Advisors and/or Tax advisors before making any investment decision.
These materials are not intended for distribution to or use by any person in any jurisdiction where such distribution would be contrary to local law or regulation. The distribution of this document in certain jurisdictions may be restricted or totally prohibited and accordingly, persons who come into possession of this document are required to inform themselves about, and to observe, any such restrictions.
MUTUAL FUND INVESTMENTS ARE SUBJECT TO MARKET RISKS, READ ALL SCHEME RELATED DOCUMENTS CAREFULLY.